A model that nails a three-step task can come apart on a thirty-step one, and pass@1 never shows you the slope. A 2026 reliability study across 10 models and 23,392 episodes found software-engineering graceful-degradation scores fell from 0.90 to 0.44 over longer horizons. Reliability is not capability.
tsukumo
Short version: pass@1 answers one question. Can the agent do this task once. That is a capability question, and most agents you can buy today pass it. The question that decides whether you ship is a different one. Does the agent stay reliable when the task runs long. Agents rarely fall over with a clean error. They degrade. A model that nails a three-step task quietly comes apart on a thirty-step one, and pass@1 never shows you the slope. A 2026 reliability study put numbers on this across 23,392 episodes. Reliability is not capability, and the metric everyone ships on cannot tell them apart.
Because it measures a single attempt at a short task, and your production traffic is neither.
pass@1 asks whether the agent succeeded on its first try. Useful for a leaderboard. Almost useless for a CTO deciding whether to put an agent on a multi-step workflow that runs for twenty minutes. The demo task is short. The real task is long. The gap between those two is where agents actually break, and a single-attempt score on a short task is blind to it by construction.
Khanal, Tao and Zhou make this the center of their 2026 paper. They call pass@1 on short tasks "structurally blind" to how performance degrades over longer horizons. Not noisy. Not approximate. Blind. The metric does not have the shape to see the failure mode that matters.
“10 models, 23,392 episodes, 396 tasks across 4 duration buckets and 3 domains. Finds pass@1 on short tasks is structurally blind to long-horizon degradation, and that reliability must be measured separately from capability.”
What's the difference between capability and reliability?#
Capability is whether the agent can. Reliability is whether it does, again and again, as the work gets longer.
A capable agent solves the hard problem once. A reliable agent solves the median problem the hundredth time, on a long task, without melting down halfway through. These are different axes. A model that tops a capability benchmark can land near the bottom on reliability. pass@1 only reads the first axis. The study defines reliability as consistent success across repeated attempts and argues it has to be measured as its own thing, never inferred from a capability number.
“A model that nails a three-step task can come apart on a thirty-step one. Reliability is not capability, and pass@1 cannot tell them apart.”
Because errors compound, the context fills with the agent's own history, and the failure is gradual rather than loud.
Each step in a long task carries a small chance of a wrong turn. Over thirty steps those chances stack. The context window fills with the agent's prior reasoning, some of it stale, and the model starts answering off its own noise. What you get is not a crash. It is a slow slide. The paper names the worst version the meltdown, where reliability collapses past a certain horizon. Across frontier models they measured meltdown rates up to 19%.
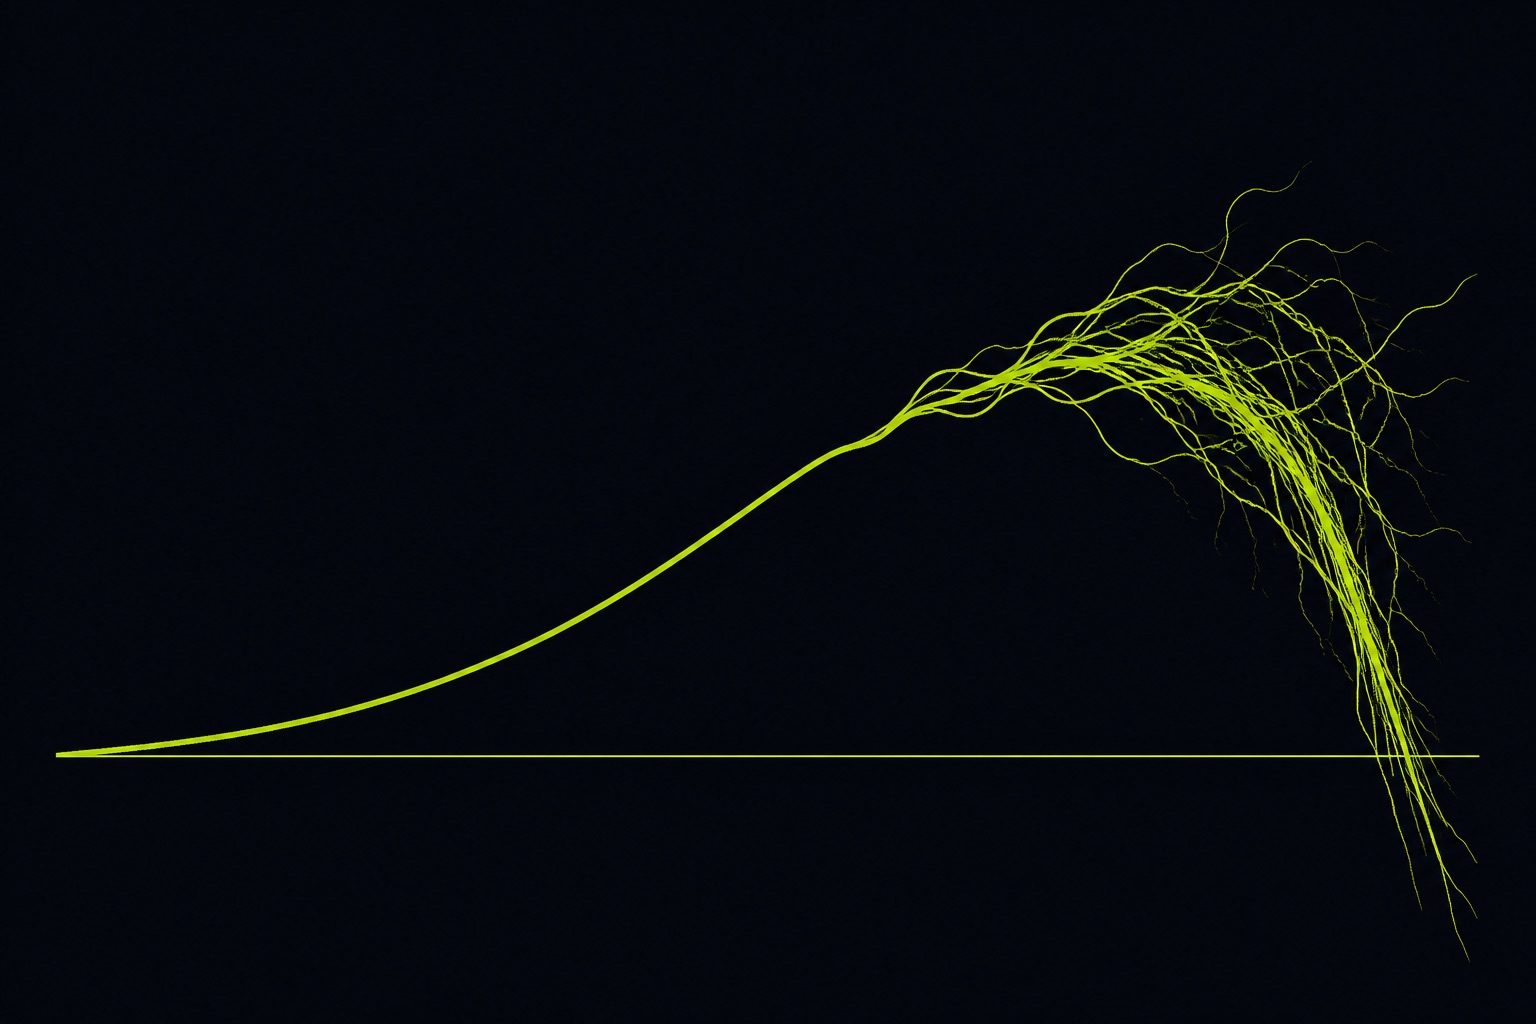
The slide is not uniform across work, either. Software engineering degraded hard. Document processing barely moved.
0.90 to 0.44
software-engineering graceful-degradation score over longer horizons
Document processing stayed near flat over the same horizons, 0.74 to 0.71
Source: Khanal, Tao & Zhou (arXiv:2603.29231)
Same models. Same horizons. One domain held, one fell apart. If you only looked at pass@1 on a short coding task, both would have looked fine, and you would have shipped the one that decays. Coding is the slice most teams put agents on, which is exactly why making coding agents reliable in production is harder than the demo makes it look.
Over the horizon, not at a single point, and you have to watch the run to see it.
The paper proposes four metrics, and the useful thing is their shape, not the acronyms. A Reliability Decay Curve, reliability plotted against task length instead of one number. A Variance Amplification Factor, how much the spread in outcomes widens as tasks get longer. A Graceful Degradation Score, whether the agent fails soft or fails catastrophic. A Meltdown Onset Point, the horizon where it stops coping. Together they answer the question pass@1 cannot. Where does the agent start to come apart, and how badly.
What each metric actually sees
Question
pass@1 / capability
Reliability over the horizon
Did it work once
yes
yes
Does it hold at 30 steps
invisible
measured (decay curve)
Is the failure soft or catastrophic
invisible
measured (degradation score)
Where does it break
invisible
measured (meltdown onset)
You cannot read any of this off a leaderboard. You get it by running the agent over real horizons and watching the slope. That is evaluation past vibes on one axis, and it is why agents that survive the demo still die before production: the demo is a pass@1, production is the whole curve. To see the decay in your own runs you need observability pointed at the horizon, rather than at the final output alone. We built yoru for this, so the variance and the slide show up as the run gets long. A meltdown you cannot see is a meltdown you hear about from a user.
This is the part of the study that should make you uncomfortable, and it is the easiest one to get wrong.
The finding: naive memory scaffolds universally harmed long-horizon performance across the models they tested. Every one. The intuitive move, give the agent more memory so it remembers the long task, made things worse.
Read it carefully, because there is a wrong lesson and a right one. The wrong lesson is "memory is bad". The right one is that piling history into the context window is bad. That is context bloat, and it is the decay mechanism from the section above wearing a different hat: a window stuffed with its own past, much of it stale, dragging the model toward a worse answer. A scaffold that grows with the task feeds the failure it was meant to prevent.
So the operating lesson is a different shape of memory. One canonical answer retrieved on demand, a pointer to the current doc, instead of a transcript that grows every step. The window stays small and current. The study endorses no product, and I will not pretend it does. It found that growing scaffolds hurt. The design that avoids the thing it found harmful is a canonical doc layer the memory taxonomies keep missing, which is the model we built trovex around: retrieve the one current answer, do not accumulate the whole history.
Most reliability work we do starts the same way. A team has an agent that demos beautifully and behaves strangely in production, and nobody can say where it starts to slide. They carry a pass@1 in their head and a decay curve in their logs, and the two do not match. The fix is rarely a bigger model. It is measuring the right axis, watching the run so the decay is visible, and keeping the context window from poisoning itself.
One caveat I will put my name to. This is one study, and reliability science for agents is young. The numbers will move as others run it. The operating lesson does not depend on the decimals. Measure reliability over the horizon instead of at a point. Watch the run so you catch the variance and the meltdown before a user does. Resolve to one canonical answer rather than letting the context window grow. Those hold regardless of which model tops next month's capability board.
If your agents pass the demo and you cannot say where they start to degrade, that is the work we do.
Part of our proof index, the studies and benchmarks behind what we claim.
We measure where your agents start to slide, make the decay visible, and fix the context bloat underneath it.
Agents that pass the demo and degrade in production?
No. pass@1 measures whether an agent can complete a task once, on a short task. It says nothing about whether the agent stays reliable as tasks get longer. Khanal, Tao and Zhou (2026) call pass@1 structurally blind to long-horizon degradation, measured across 23,392 episodes. For production you need reliability measured over the horizon, not a single-attempt capability score.
How do you measure agent reliability?
Over the horizon, not at one point. The Beyond pass@1 framework (2026) proposes a Reliability Decay Curve (reliability against task length), a Variance Amplification Factor (how outcome spread widens), a Graceful Degradation Score (soft versus catastrophic failure), and a Meltdown Onset Point (where it stops coping). You also need observability on the running agent to see the slide before a user does.
Do memory scaffolds help long-horizon agents?
In the study, no. Khanal, Tao and Zhou (2026) found naive memory scaffolds universally harmed long-horizon performance across every model tested. Piling history into the context window is context bloat, which drags the model toward stale answers. The fix is a different shape of memory: one canonical answer retrieved on demand, a pointer to the current doc, instead of a transcript that grows each step.
What is the difference between agent capability and reliability?
Capability is whether an agent can do a task at all. Reliability is whether it keeps succeeding as the task runs long and repeats. They are separate axes. A model that tops a capability benchmark can rank low on reliability, because long tasks compound errors and fill the context window with stale history. pass@1 reads only capability, which is why the 2026 reliability study argues for measuring reliability on its own.